Vector presentation template
A precision style built on tiles with a single clipped corner, tidy grids and thin-line icons. Colors and fonts adapt to your brand, so one engineered structure suits product, data and process presentations.
Upload your PowerPoint or PDF and get it rebuilt in this style, with your content kept intact. Or describe a topic and start a new deck.
Use this style
🖼️ Slides in this style



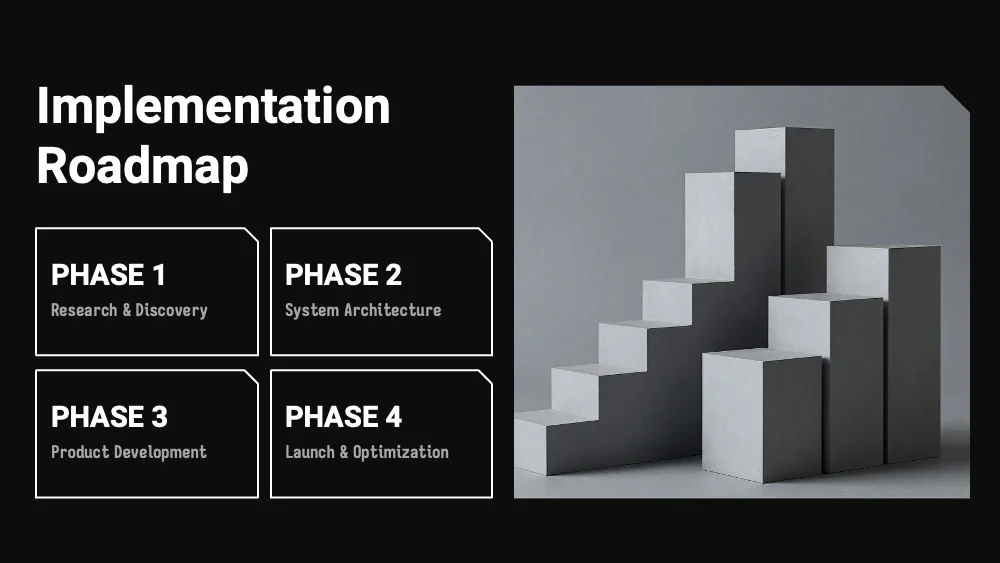
About this style
Vector is defined by geometry, not by palette. Every content block is a flat tile with one clipped corner, usually at the top right, which gives grids an engineered, cut-from-sheet look. Tiles line up in strict rows and columns: two-column comparisons, four-tile roadmaps beside a photo, statistic boards with large numerals next to a chart, and icon-and-caption rows. Photos share the clipped corner, and tall section-divider images sit beside a small number and title. Process slides connect circular icon badges with thin curved arrows and dotted drop lines, while icons are drawn as fine outlines. Centered statement slides leave generous empty space around a single sentence. Typefaces and colors are not fixed: they come from the user’s brand or theme, and the forms stay constant. The style suits product and engineering updates, technology reports, research summaries and process explanations. It handles numbers, short lists, comparisons and architectural or abstract imagery well. It is less suited to emotional storytelling and long paragraphs.
Questions and 💬 answers
Does Vector adapt to my brand colors and fonts?
Yes. Colors and typefaces are not part of the style, so any brand palette and any font family can be applied. The clipped-corner tiles, strict grids and thin-line icons stay the same, which keeps every slide recognizable and consistent while looking native to your brand.
Does Vector handle numbers and KPIs well?
Yes. The statistics layout pairs large numerals with short captions on separate tiles, and a chart sits on its own panel in the same grid. The strict alignment makes figures easy to compare at a glance, and every indicator gets a clean frame of equal weight.
Does Vector work for a step-by-step process?
Yes. Circular icon badges linked by thin curved arrows show direction at once, and numbers above dotted drop lines give each step a fixed place. Four-tile roadmaps beside a photo offer a compact alternative, so processes read as clear, ordered sequences.
✨ Similar styles
Grid
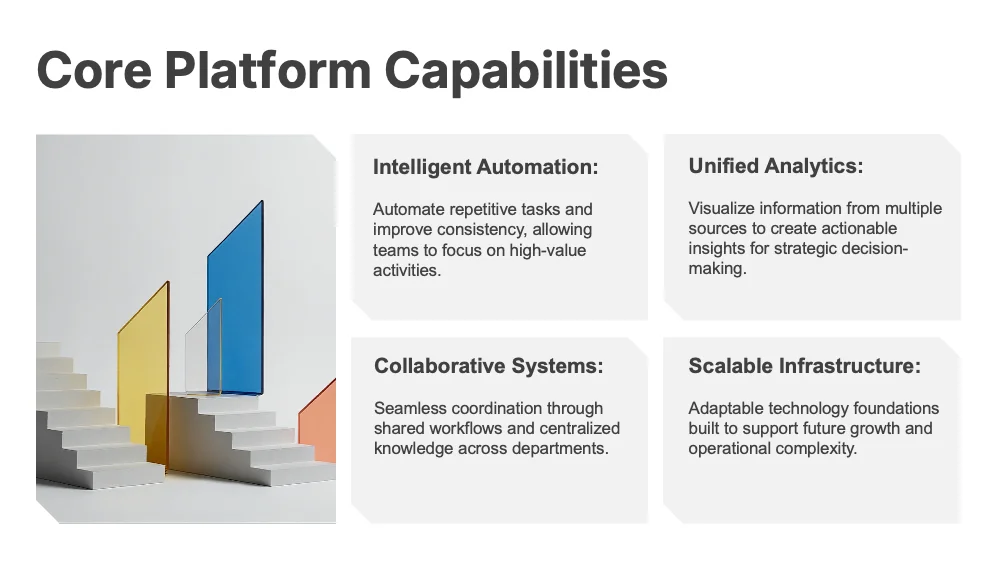
A modular style built on a grid of panels with clipped corners, where hierarchy comes from size and weight rather than decoration. Colors and fonts adapt to your brand, so one modular structure suits reports, KPI reviews and strategy decks.
- Pitch deck
- Business report
- Research

Clean Tech
A cool light-grey style with blue-grey cards, clipped corners and a condensed technical typeface. Suited to product, engineering and analytics presentations that mix process steps, comparisons and key figures in a precise, uncluttered way.
- Pitch deck
- Business report
- Research
Contour
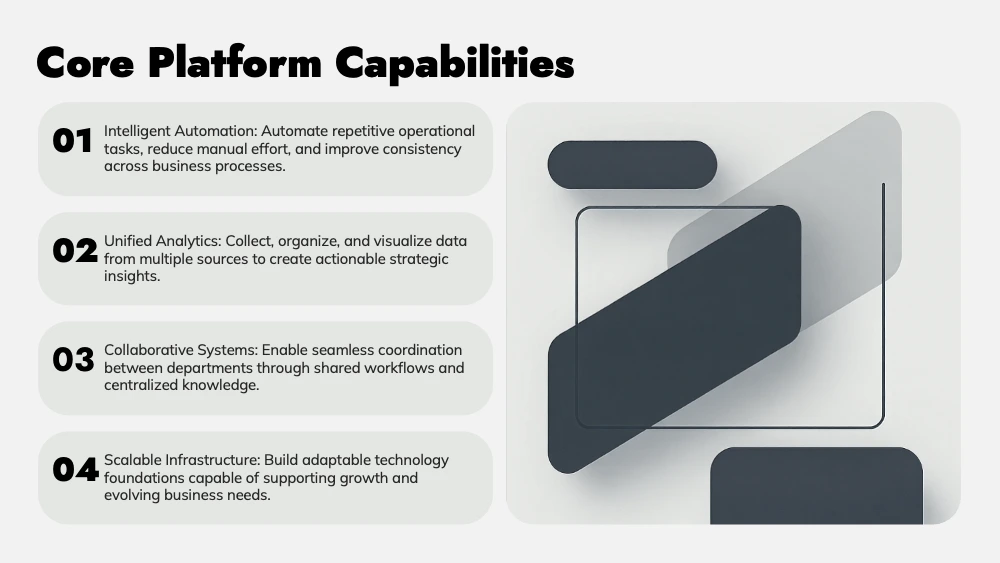
A style built on rounded plates that hold every block of content. Plates can be filled with one color or several contrasting ones, and fonts adapt to your brand, so one simple structure suits pitches, comparisons and product decks.
- Pitch deck
- Marketing
- Sales
Give your slides a new look
Try it for freeVectorUse this style