This article is part of a larger research project that was aimed at discovering the main difficulties users face when creating presentations. The data that was used as the foundation for this article can be found here. You can also test your slide designing skills using Wondercheck, our new custom GPT.
Know your audience
Before you even begin building on your presentation, you need to get to know your audience. What are their backgrounds? Are they experts at the subject at hand, or will they need more context? Are they looking to engage with the presentation, or do they just want raw numbers laid out the fastest way possible?
So, to start, you need to clearly define your target audience: company employees, training department specialists, students, clients, advertisers, etc. This information will lay the foundation for your slides.
One very common mistake when making a presentation is using abbreviations, complex or technical terms that aren’t known to your audience — not only are they unlikely to understand what’s on the slide, but this is also likely to lower their engagement going forward. You need to make sure that the terminology you use is either well-known, or clearly explained.
Knowing your audience is key to making them feel interested and engaged, as well as being able to “read the room” so make sure to never skip this part. Otherwise, the quality of your slides might have very little impact on the overall success of your presentation.
Composition is key
When making presentations, composition usually takes up the bulk of your work time. While it may seem insignificant to some, composing your slide properly can make all the difference when it comes to legibility and engagement. Presentations that adhere to certain design principles are proven to be more effective, regardless of their content or target audience.
Try to limit yourself to one idea per slide – if there are several disparate thoughts on it, you need to either remove the secondary information, or divide said slide into several slides. Overloading a slide with content is a serious mistake and a surefire way to make your audience less engaged. You need to break large blocks of information into pieces so that they are easier to remember.

However, sometimes limiting yourself to just one slide just isn’t possible. If that’s the case, then it is recommended to divide the slide visually into semantic parts using tiles, then arrange the parts from top to bottom and from left to right depending on the degree of their importance. Think about the emphasis in each part and accentuate it with color or size.
On a “good” slide, text information is always accompanied by visual elements. For instance, a text bullet can be accompanied by a corresponding icon on the left. If the slide mentions specific people, then instead of icons you should use their photos, but it’s imperative that all icons and photos are designed in the same style.
When showing charts, graphs, or tables, one cool technique for adding some life to your slides is placing the elements in a mock-up (a .png image of a laptop/phone/tablet). This is something that is extremely simple to execute, but will give your presentation a more polished look when showing any kind of data.

Another important thing to remember is to keep everything in alignment. All text has to be aligned either to the center, or to either side — using different text alignments on the same slide is a serious mistake. A mistake that might seem almost too easy to make, but you’d be genuinely surprised at how many people make it — at least we were.

Armed with this knowledge, your slide composition skills are already way above average. But if that’s not enough, here’s a few more tips to improve them even further:
- Remember to leave some air: at least 40% of the slide area should not be occupied by content of any sort. Keep in mind, however, that according to our research, this varies highly by county. For instance, in some Asian countries it’s not uncommon to have much less “air” on the slide than in European ones
- While using bullets is generally a good practice, try to limit the slide to 6 bullets max — any more is overload
- The volume of text in your bullets should be more or less identical, otherwise the larger bullet might “outweigh” the others, giving it more perceived significance
- Text and visual elements shouldn’t stick to the edges of the slide — indentations of at least 1-2 cm are required. Text itself shouldn’t be too long and distracting
- If there are important numbers on your slide, don’t hesitate to accentuate them with larger text and/or different colors
Making a good first impression
The first impression is always vital when making connections, and presentations aren’t much different. Your first slide will set the tone of the presentation — if it’s not done correctly, you’re running the risk of losing your audience before your pitch can even begin. Luckily, as with composition, following some basic guiding principles will go a long way in making your first slide stand out, ensuring your presentations always start off with the audience fully engaged.
The key to making the best first slide is striking the right visual balance. The slide can’t be neutral, but overloading it is also a mistake — either of these things can immediately put your audience off. Being bold while maintaining balance isn’t easy and will take practice, but also inspiration. Looking at other people’s (or, better yet, companies’) presentations will help give you an idea of what to do or not to do for your first slide.
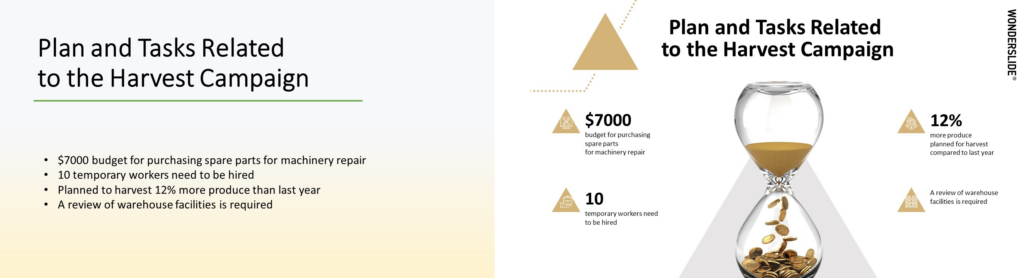
But to save you some time, here’s an example showing how a rather average-looking slide can be transformed using correct design principles.

The font can make or break a presentation
When dealing with fonts, the majority of people tend to default to one of the “classic”, ubiquitous choices: Times New Roman, Arial, or, God forbid, Comic Sans. This might be OK (sometimes, even preferable) when making documents, but in a presentation format, these fonts appear obsolete and lack any real “punch”, so using them isn’t ideal.
For the body of your text, it’s recommended to use a clean and concise sans-serif font. Flashy, decorative fonts can be great on a title slide or in a heading, but should never be used as your main font for smaller text. Oh, and make sure to only use 2 fonts per slide, max. Ideally, your entire presentation won’t have more than 2-3 different fonts, as any more than that only works to create visual confusion.
In regards to font size, remember: the perceived significance of elements on your slide is determined by how much they differ from other elements – therefore, the slide title should be clearly larger than normal text, and accents should be clearly larger than regular text. Two to three font sizes on a slide are the optimal set.
Colors add life to your slides
Picking a color theme for your presentation can be more difficult than some people think, especially if you don’t have any brand colors to guide your decision. While this tends to be more of a creative decision rather than a practical one, some themes tend to work better in combination with a certain color. Here are some examples:
- Yellow: for taxi services, travel services, fitness projects, children’s products, construction work, etc.
- Orange: for FMCG projects, advertising services, engineering companies, active sports, online services, etc.
- Red: for logistics, manufacturing companies, fast food industry, sports projects, retail brands, etc.
- Purple: for events, music and interactive projects, exhibitions, premium services, etc.
- Blue: for financial services, banks, corporate sales, shipping, everything related to cold, etc.
- Blue: for cloud solutions, IT projects, air travel, medical projects, everything related to water, etc.
- Mint: for cafes or desserts, holidays and tour agencies, jewelry brands, medicine, etc.
- Green: for startups, IT, market research, projects related to ecology, agriculture, wellness, etc.
- Gold: for the entertainment sector, hotel or restaurant themes, as well as premium services.
- Gray: neutral color and should be used in combination with bright and pure colors. This will allow for good contrast between elements.
These are some general guidelines, but in reality, colors are fair game. The one thing you need to remember though, regardless of which color you use, is contrast. The text should always be easy and comfortable for the eyes in contrast with your background, otherwise it doesn’t really matter which color theme you’ve decided to pick.
Using visual objects correctly
When highlighting an object or a product, it’s considered good practice to add a picture. The classic composition for such a slide is placing the photo of the product in the center, with bullet points on either side describing the properties, characteristics or advantages of the product, person, or even a website interface.
For such compositions, we recommend using an object without a background. You can find such images (usually .png files) on various websites for free, or make your own by removing the background in PowerPoint. If the slide doesn’t go in-depth on how the product works, but simply talks about it, then you can place the object on one side of the slide and list its advantages on the other.
An interesting trick that will draw more attention to the product by making it appear larger is to position the photo so that a part of it is tucked behind the bottom edge of the slide. This approach also works great with portraits.


Using background images correctly
If your slide needs to be accompanied by a photo, make sure that all images are of good quality and that there is no text superimposed on top of the photo.
Having more than one photo on the slide is risky, but if you decide to do it, you need to make sure that they do not visually merge into one – to prevent this, you can add small dividers using lines in the background color. It is advisable that the number of photos does not exceed 4, and that all photos are in the same color scheme, but remember: one beautiful, full-scale photo is better than 5 smaller ones. If there are several portraits on a slide, then the style and angle of the photos should always be the same.


Using charts & graphs
Charts, graphs and tables are the biggest presentation pain point when it comes to most people. Not only are they boring to make, but making them look good on a slide can be a truly monumental task.
If there is a graph on the slide, as a rule, you can always use it to highlight the main idea. To do this, simply look for the most important number on the graph/diagram and take it out. For example, this could be sales growth for the quarter or for the year. You can not only make this number the largest on the slide, but also place it on a contrasting background, and highlight the desired segment with a bright color.
A very important rule to remember is to never have your graph/chart be the only thing on the slide — there should always be a title, or an explanation, and it should be either above or to either side, but never underneath — that space is reserved for your footnotes, if needed.
When it comes to color coding graphs/charts, gray color will help control attention and not violate the color code of the slide. First, decide which category is the most important in your chart. Highlight it with the main color, and the remaining indicators can be muted by painting them in shades of gray, or by using a more muted tone derived from the main color.
It is also important to consider the features of each different type of diagram. For instance, a pie chart does great when showing the ratio of a small number of values – from 2 to 5, which differ noticeably from each other. When there are too many values, however, the difference between them becomes too difficult to read, even if they are properly color coded. If there are more than five segments in a pie chart, we recommend using columns or a bar chart instead.
We also highly recommend that when using pie charts, you sort the data in ascending order – it will make the chart significantly easier to understand and absorb.


Closing the Show
The final slide of your presentation can be just as important as the first one, sometimes — even more so. While the job of the opening slide is to engage the listener, the final slide should typically carry a concrete CTA. Don’t make the mistake most people make when closing out their presentation — a simple “Thank you” or “The end” just won’t do anymore.
Use the final slide to its fullest potential — and maximize your presentation’s impact.
Final thoughts
With AI models developing at the current rate, the entry barriers to becoming an entrepreneur will soon be virtually non-existent. In the very near future, anyone will be able to code an app or a website, design it and deploy it, all using AI.
Up until this moment, it was an accepted truth in the business world that a good idea in itself is actually worthless — the worth is generated by one’s ability to execute that idea. But now, with execution becoming more and more accessible, the inherent value of an idea will grow exponentially. Therefore, making it easier to get those ideas out, and doing it in the correct way, is becoming more essential than ever.
That was a big part of our thinking when developing Wonderslide, but even more so the reason for coming up with Wondercheck: our new custom GPT for evaluating the design and composition of your presentation slides. We believe that the role presentations play in moving the needle on innovation is becoming increasingly more important.
Put your newfound knowledge to the test!
Want to test out how well you managed to implement all this info into your presentation? We built Wondercheck so that you’ll never have to guess if your slides look up to par — our custom GPT will analyze your slide and instantly suggest tips and improvements. It’s just like having a professional graphic designer give you personal feedback, only free!