Updated 2026-10-01.
Wonderslide builds infographics from your data: timelines, charts and processes with small text. Our infographic mode runs on GPT Image 2 at its medium quality tier, $0.11 an image. We wanted to know two things: whether a cheaper model is no worse on small text, and how other image editors compare.
The person who ran this study, its owner, checked original images by eye. In the human-reviewed first generation across the same seven cases, the owner accepted 71 of 71 lines for GPT Image 2 medium and GPT Image 2.5 low, versus 43 of 71 for Nano Banana 2 Fast. A line here is one caption on a timeline, such as "2009 — Founded in Verano"; the seven slides carry 71 of them. Image sizes (frames) returned: GPT Image 2 medium 2048×1152, GPT Image 2.5 low 2560×1440, Nano Banana 2 Fast 2741×1530. This comparison applies to these reviewed outputs; it is not a market-wide ranking, an exact character-error estimate, or a guarantee for later generations.
GPT Image 2.5 low costs a third as much as GPT Image 2 medium: $0.245 against $0.770 over the seven cases.
In September 2026 Wonderslide tested 29 image models on seven synthetic timeline slides: 250 generations scored automatically (OCR, text recognition), plus a person’s review of original images: the first generations of three models, and nine diagnostic images from four others. Every prompt, score, review judgment and generated image (as previews) is published at the end of this article.
Key takeaways
- A person accepted every body-text line from GPT Image 2 medium and GPT Image 2.5 low. That is 71 of 71 in the first generation of each slide, against 43 of 71 for Nano Banana 2 Fast. The frames differed, and the review covers these three models only.
- GPT Image 2.5 low costs a third of GPT Image 2 medium over the seven cases. Automatic scoring over three runs each cannot separate the two on text quality either.
- Automatic scoring is not the final word. On the 205 first-generation lines a person could judge for the three reviewed models, it disagreed with the review on 44 (21.46%), and in 41 of those 44 it marked a line wrong that the person accepted. Every score not marked as checked by a person is automatic.
- The top tier buys nothing measurable. On automatic scoring, GPT Image 2 high reproduced 58 lines against 56 for medium on one generation per case, at 3.7 times the price (frames differ; see the table).
- Cyrillic held up when a person checked. All 10 Cyrillic lines from GPT Image 2.5 low and from GPT Image 2 medium were accepted, where automatic scoring counted 7 and 9. Over all runs, automatic scoring counted 18 Cyrillic misses against 4 Latin ones for the five GPT tiers, a gap the review did not confirm in the first generation of the two reviewed tiers; the other runs were not reviewed.
GPT Image tiers compared: price and text accuracy
| Tier | Price for the 7 cases | Checked by a person: exact lines (of 71) | Automatic OCR: exact lines, first generation (of 71) | Automatic OCR: character error rate, first generation | Frame returned, first generation |
|---|---|---|---|---|---|
| GPT Image 2 low | $0.210 | not reviewed | 52 | 0.049 | 2048×1152 on 4 cases, 2560×1440 on 3 |
| GPT Image 2 medium | $0.770 | 71 | 56 | 0.060 | 2048×1152 on 7 cases |
| GPT Image 2 high | $2.870 | not reviewed | 58 | 0.072 | 2048×1152 on 5 cases, 2560×1440 on 2 |
| GPT Image 2.5 low | $0.245 | 71 | 61 | 0.041 | 2560×1440 on 7 cases |
| GPT Image 2.5 medium | $0.385 | not reviewed | 59 | 0.050 | 2560×1440 on 7 cases |
How we tested
Each of the 29 participants got the same half-finished 1280×720 slide (a flat background and a title) and a written brief: draw a horizontal timeline with the exact lines listed, in order, without touching the background or the title. The participants were 24 third-party image editors and five GPT Image tiers: GPT Image 2 low, medium and high, and GPT Image 2.5 low and medium. Each tier counts as its own participant.
The seven slides differ in block count (3, 10 or 18), script (Cyrillic, Latin or mixed), brief length and illustration style (detailed instead of flat icons). Most pairs differ along one axis; the limitations below name the exception that matters here. In round 1, the first generation, every participant was given every slide once. The eight finalists (the five GPT Image tiers, Nano Banana 2 Fast, Seedream 5.0 Pro and Luma Uni) were then run up to two more times per slide, to see how much the result moves between identical runs. GPT Image 2 high, the most expensive tier, was not repeated.
Every score except the human review comes from automatic scoring (OCR, text recognition): a recognizer reads the text back from each image, and a script compares it with the reference lines. Every model was called through one API intermediary, on the catalog snapshot of 2026-09-17.
The owner of the study then compared the visible words and numbers in 30 original generated images with the reference text, 304 expected lines in all. 21 images were the main sample: all 7 slides, first generation, for GPT Image 2 medium, GPT Image 2.5 low and Nano Banana 2 Fast. The other 9 were diagnostic images, picked because earlier checks had flagged them as failures.
A model refusing to attempt a slide because the brief was too long is a different outcome from a model drawing the slide badly, and we kept the two separate throughout: of 203 first-round cells, 36 are refusals on prompt length, 163 were generated and scored, and 4 failed on the platform’s side without producing an image.
Both metrics below are automatic. We publish two text metrics, not one: lines reproduced exactly and characters reproduced wrongly. On a single generation per case the five GPT tiers sit between 61 and 52 exact lines out of 71, and between 0.041 and 0.072 wrong characters.
GPT Image vs Nano Banana 2: what a person found in the original images
On the same 7 cases in the first generation, the owner accepted 71 of 71 lines for GPT Image 2 medium and 71 of 71 for GPT Image 2.5 low, versus 43 of 71 for Nano Banana 2 Fast. Nano Banana also had 19 readable deviations, 8 unreadable lines and 1 absent line. This is the human-reviewed comparison; the entire market and later runs have not been reviewed by eye.
Frames differ: Nano Banana returned 2741×1530, GPT Image 2.5 low 2560×1440, and GPT Image 2 medium 2048×1152.
These are human judgments about words and numbers, not an independent transcription or a certification of capitalization, punctuation, aesthetics or title preservation.
The 9 failure-selected diagnostic images contain 91 expected lines: 75 were judged unreadable and 16 absent. None was accepted as exact. This is evidence about the specifically flagged outputs, not a random sample of recognizer performance.
How reliable are the automatic scores?
The owner reviewed 30 original images and 304 expected lines. In the stratified sample, automatic exact-line scoring disagreed on 44 of 205 determinate human judgments, or 21.46%. This is measurement-pipeline disagreement, not recognizer-only character error.
The 8 unreadable stratified lines are excluded from that denominator. The separately selected diagnostic images are not pooled into the rate. No complete manual transcription exists for every deviation, so a pure recognizer character-error rate cannot be claimed.
Of the 44 disagreements, 41 were lines a person accepted that automatic scoring marked wrong, and 3 were lines it accepted that a person did not. The rate differs by model: 14.08% for GPT Image 2.5 low, 21.13% for GPT Image 2 medium and 30.16% for Nano Banana 2 Fast.
These rates are conditional on the reviewed, readable-or-absent lines; they are not global correction factors. Do not multiply other automatic scores by them.
The source readings show short-word omissions and substitutions such as K-1 read as K-l, production line №1 read with Ng1, 1000-я read with Cyrillic O letters, and fragments interleaved between neighboring columns.
All 29 models: automatic scores and what a person checked
This table lists every participant. The automatic scores are the original measurements and have not been corrected. For the three models a person reviewed, they came out lower than the human count: 56 against 71 for GPT Image 2 medium, 61 against 71 for GPT Image 2.5 low and 30 against 43 for Nano Banana 2 Fast.
| Model | Group | Automatic OCR: exact lines, first generation | Checked by a person: exact lines | Frame returned | Price per generation | Slides covered (of 7) |
|---|---|---|---|---|---|---|
| GPT Image 2 low | GPT Image | 52 of 71 | not reviewed | 2048×1152 (4), 2560×1440 (3) | $0.030 | 7 |
| GPT Image 2 medium | GPT Image | 56 of 71 | 71 of 71 | 2048×1152 | $0.110 | 7 |
| GPT Image 2 high | GPT Image | 58 of 71 | not reviewed | 2048×1152 (5), 2560×1440 (2) | $0.410 | 7 |
| GPT Image 2.5 low | GPT Image | 61 of 71 | 71 of 71 | 2560×1440 | $0.035 | 7 |
| GPT Image 2.5 medium | GPT Image | 59 of 71 | not reviewed | 2560×1440 | $0.055 | 7 |
| Boogu | Third-party editor | 0 of 71 | not reviewed | 1024×576 | $0.060 | 7 |
| FIBO | Third-party editor | 0 of 61 | not reviewed | 1360×768 | $0.040 | 6 |
| Flux 2 Dev | Third-party editor | 0 of 71 | not reviewed | 2048×1152 | $0.024 | 7 |
| Flux 2 Pro | Third-party editor | 1 of 71 | not reviewed | 2048×1152 | $0.060 | 7 |
| Flux 2 Turbo | Third-party editor | 1 of 71 | not reviewed | 2048×1152 | $0.048 | 7 |
| Grok Imagine Image 2.0 | Third-party editor | 0 of 71 | not reviewed | 2816×1584 | $0.060 | 7 |
| HiDream O1 | Third-party editor | 0 of 71 | not reviewed | 2560×1440 | $0.040 | 7 |
| Ideogram v4 | Third-party editor | 0 of 3 | 0 of 3 (diagnostic images only) | 2720×1536 | $0.100 | 1 |
| Kling Image O3 | Third-party editor | 0 of 3 | not reviewed | 2720×1536 | $0.028 | 1 |
| Kling Image V3 | Third-party editor | 0 of 3 | not reviewed | 2720×1536 | $0.028 | 1 |
| Luma Uni | Third-party editor | 15 of 61 | not reviewed | 2784×1504 | $0.042 | 6 |
| MAI Image 2.5 | Third-party editor | 5 of 33 | not reviewed | 1360×768 | by prompt length | 4 |
| Nano Banana | Third-party editor | 1 of 33 | not reviewed | 1344×768 | $0.038 | 4 |
| Nano Banana 2 Fast | Third-party editor | 30 of 71 | 43 of 71 | 2741×1530 | $0.045 | 7 |
| Nano Banana 2 Lite | Third-party editor | 14 of 71 | not reviewed | 1376×768 | $0.040 | 7 |
| Qwen Image 3.0 | Refused every slide | n/a | n/a | n/a | $0.033 | 0 |
| Qwen Image 3.0 Pro | Refused every slide | n/a | n/a | n/a | $0.075 | 0 |
| Qwen Image Edit Plus | Third-party editor | 0 of 71 | 0 of 30 (diagnostic images only) | 1360×768 | $0.020 | 7 |
| Seedream 4.0 | Third-party editor | 4 of 71 | 0 of 10 (diagnostic images only) | 2560×1440 | $0.027 | 7 |
| Seedream 4.5 | Third-party editor | 12 of 71 | not reviewed | 2560×1440 | $0.040 | 7 |
| Seedream 5.0 Lite | Third-party editor | 0 of 71 | not reviewed | 2560×1440 | $0.035 | 7 |
| Seedream 5.0 Pro | Third-party editor | 16 of 71 | not reviewed | 2730×1536 | $0.090 | 7 |
| Step1X Edit | Third-party editor | 0 of 71 | 0 of 48 (diagnostic images only) | 1392×752 | $0.030 | 7 |
| Wan 2.7 | Third-party editor | 8 of 71 | not reviewed | 2560×1440 | $0.030 | 7 |
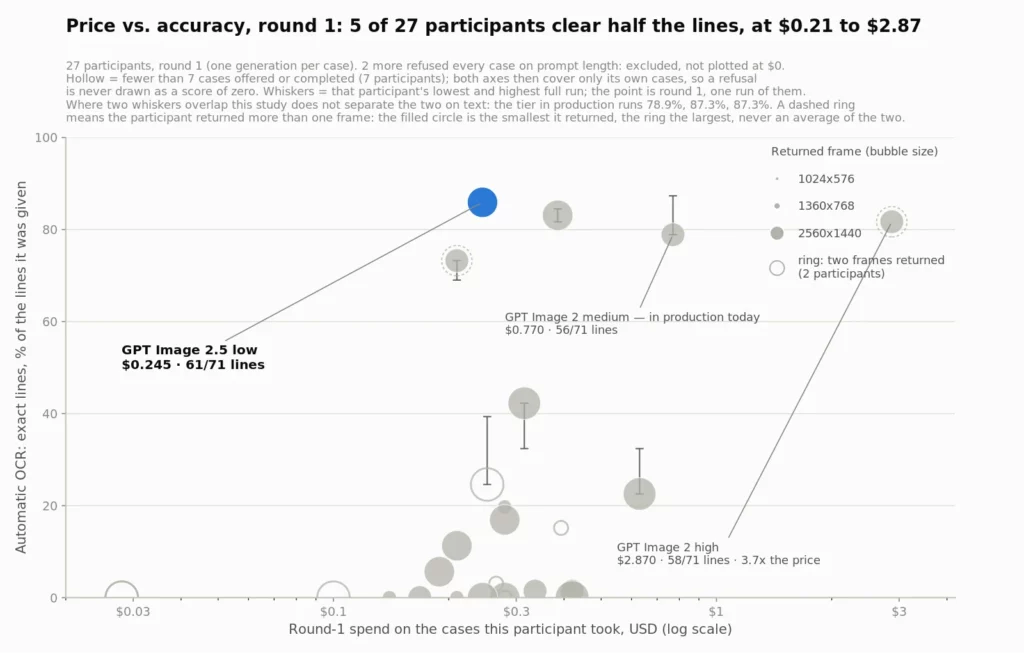
Automatic OCR (uncorrected), price vs. accuracy, round 1: 5 of 27 participants clear half the lines, at $0.21 to $2.87. A person counted lines for only three of these models.
GPT Image 2 vs 2.5: low, medium and high tiers on small text
If you already use GPT Image, the real choice is between versions and quality tiers. The pair that matters most to us is GPT Image 2 medium, the tier our product runs on, against GPT Image 2.5 low, the newer version’s cheapest tier. In the human review both had all 71 lines accepted in the first generation. The scores below are automatic; the tier comparisons use three runs each, except the top tier, which was run once.
On text quality the two tiers do not separate. Each was run over the seven cases three times. The tier in production returned 56, 62 and 62 exact lines out of 71; the cheaper tier returned 61, 62 and 61. The tier in production moves across six lines on its own, which is more than anything that separates the two.
The two tiers were not drawn on the same canvas either: the tier in production returned the smaller 2048×1152 on 19 of its 21 generations, the cheaper tier 2560×1440 on all 21.
Unequal frames are a condition to report, not a proven cause of the automatic line gap. Human review accepted every body-text line of both compared GPT tiers in the first run. The price gap is independent of frame size and recognition.
On the repeated tiers the two metrics part company, and we say so rather than picking the flattering one: on the median of three repeats GPT Image 2 medium has the lower character-error rate, 0.0225 against 0.0546, while GPT Image 2.5 low has one more exact line, 62 against 61 out of 71.
Paying above the tier in production buys nothing measurable: counted the same way as the medium tier, GPT Image 2’s top tier reproduced 58 lines against 56 out of 71 while costing 3.7 times as much. Those 58 and 56 are one generation per case, and the frames differ (see the first table).
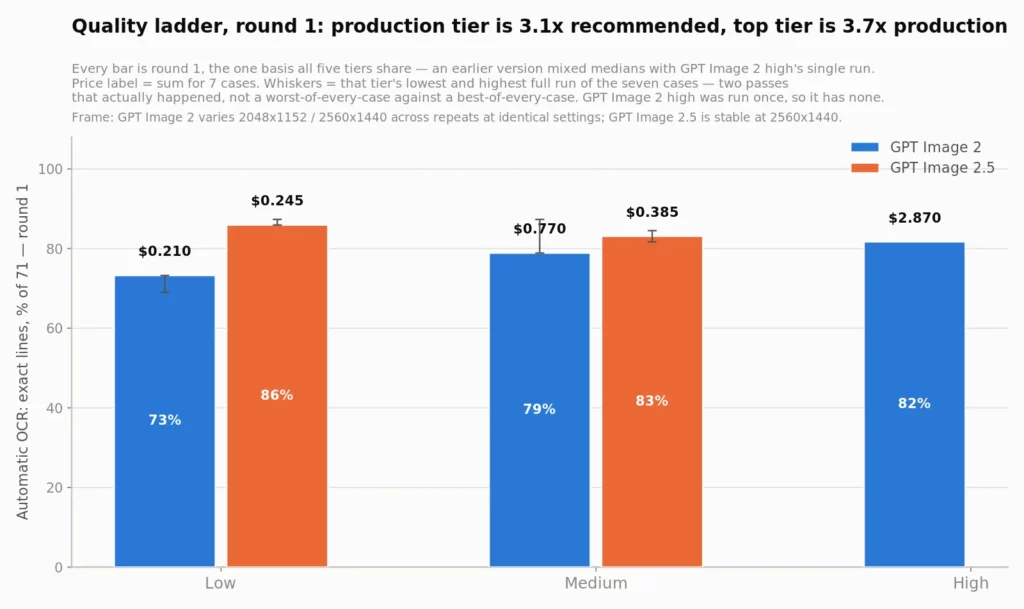
Automatic OCR, quality ladder, round 1: production tier is 3.1x recommended, top tier is 3.7x production. In plain terms, GPT Image 2 medium costs 3.1 times GPT Image 2.5 low, and GPT Image 2 high costs 3.7 times GPT Image 2 medium.
What we recommend
The run-to-run numbers in this section are automatic scores. The human review covers the first generation only.
For this job, move down a version rather than up a tier, and move for the price, not for the text. The newer version’s low tier costs a third of what the tier in production costs, $0.245 against $0.770 over the seven cases; its medium tier costs half, $0.385. Run three times each, the three tiers land between 56 and 62 exact lines out of 71 and this study cannot separate them on text quality. On the median of the three repeats the tier in production is the one with the cleanest characters (0.0225, against 0.0546 for the low tier and 0.0490 for the medium one), and that is the caveat the move carries.
The cheapest tier in the study is not the one we recommend. GPT Image 2 low costs $0.210 over the seven cases against GPT Image 2.5 low’s $0.245, and it is the one tier whose text this study can tell apart from the tier in production: over three runs of the seven cases it returned 52, 49 and 51 exact lines out of 71, where the tier in production returned 56, 62 and 62.
The price gap does not depend on text recognition: it is list-price arithmetic from September 2026. Before you switch, test the new tier on your own slides. The human review covers one generation of each slide, and the repeats were scored automatically.
Steadiness between identical runs
The same prompt does not always give the same slide. These are automatic scores, and one check by a person, described at the end of this section, shows that they can be off. Here the newer version is GPT Image 2.5 and the older one is GPT Image 2.
The newer version’s medium tier is far steadier between identical runs than the older version’s: across three runs of the same slide it never moved by more than 1 exact line on any of its 7 cases, where the older version’s medium tier gave 8, 16 and 13 exact lines on the same 18-line slide, an 8-line swing, 44% of the slide.
Steadiness is a property of a tier, not of a version: the newer version’s low tier moved by 2 lines on 3 of its 7 cases, and the older version’s low tier by no more than 3 on any of its.
A person checked the first generation of the older version’s medium tier on the 18-line slide and accepted all 18 lines, where automatic scoring counted 8. So the 8-line swing is partly a scoring effect; the other two runs were not reviewed.
Can AI image models write Cyrillic?
For GPT Image 2.5 low and GPT Image 2 medium, yes, on this template. It is Russian text on a timeline, so this tests those two tiers, not the alphabet in general. In the human review, each had all 10 lines accepted on the Cyrillic and on the Latin version of the same 10 events, where automatic scoring counted 7 and 9 of 10 on the Cyrillic version. For GPT Image 2.5 low, the Cyrillic gap in the automatic scores (7 of 10 against 10 of 10 on the Latin version) comes from the scoring, not from the images, in this first generation.
The automatic scores over all runs show a gap instead. ‘These models can’t do Cyrillic’ does not survive measurement. But Cyrillic is not free either. On the same 10 events written in Russian and in English, the five GPT tiers missed 18 Cyrillic lines against 4 Latin ones, over the identical 13 runs each version of the slide received.
A third-party editor that struggles with small text struggles more with Cyrillic than with Latin on the exact same content: 5 of 10 lines against 8 of 10. Those two numbers are Nano Banana 2 Fast on the median of three repeats. In the human review of its first generation, a person accepted 2 of 10 Cyrillic lines and 10 of 10 Latin lines (on that same generation automatic scoring counted 1 of 10 and 8 of 10), so for this model the gap is in the images too.
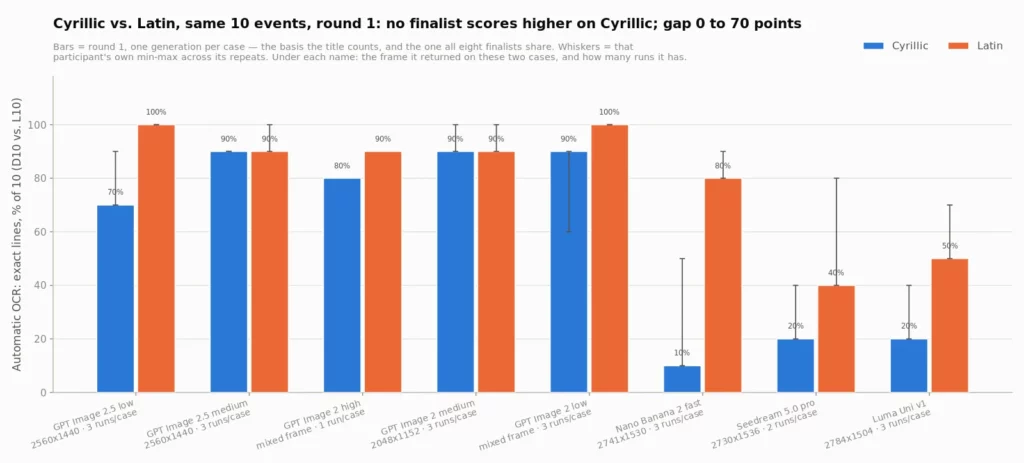
Automatic OCR, Cyrillic vs. Latin, same 10 events, round 1: no finalist scores higher on Cyrillic; gap 0 to 70 points.
Does more text on a slide break the models?
Short answer: in the one case a person checked, no. Automatic scores show one GPT tier falling off at 18 blocks, and the review shows that this drop was a scoring effect in the image checked.
We compared the 10-block and the 18-block slides, whose briefs are close in length, so the block count is what changes. The scores in this paragraph and the next are automatic, and frames differ between tiers; see the table above.
Only one tier of the five falls off at 18 blocks, and it is the tier in production. Round 1, the share of exact lines on the densest case: GPT Image 2.5 low 89%, GPT Image 2.5 medium 83%, GPT Image 2 low 83%, GPT Image 2 high 67%, GPT Image 2 medium 44%. Four of the five land between 67% and 89%; the fifth is at 44%.
That tier, GPT Image 2 medium, fell off on a slide where three identical runs returned 8, 16 and 13 exact lines of 18. Round 1 drew the 8, and round 1 is what the bars plot. On the median of the same three runs that cell is 13 of 18 (72%), back inside the range the other four tiers occupy, and nothing is left to call a break.
A person checked that first generation and accepted all 18 lines, where automatic scoring counted 8. In this image the drop is a scoring effect. For Nano Banana 2 Fast the person accepted 1 of 18 lines on the same slide, so there the drop is real.
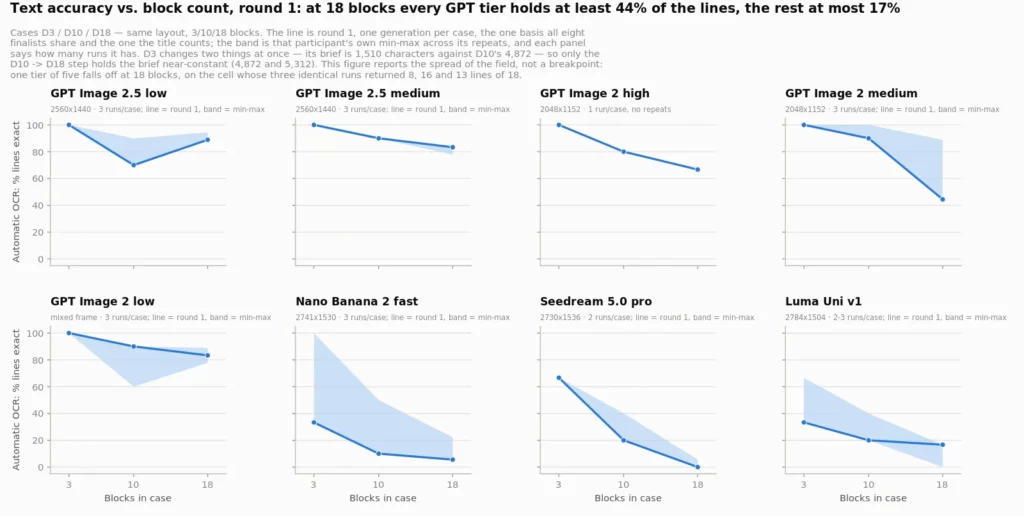
Automatic OCR, text accuracy vs. block count, round 1: at 18 blocks every GPT tier holds at least 44% of the lines, the rest at most 17%. By eye, GPT Image 2 medium had 18 of 18 on the 18-block slide, where this chart shows 44%.
Limitations
What this study did not measure, and why it matters for reading the numbers:
- One API intermediary. Every model was called through one intermediary, on the catalog snapshot of 2026-09-17. Prices come from its price list, not from invoices. Results may differ through another channel, a vendor’s own product or a later catalog.
- The human review is partial. A person reviewed body text in 30 original images: the first generation of three models, plus 9 flagged images. Other models, later runs, image aesthetics and titles were not reviewed. The reviewer saw the reference text and enlarged crops, so the review was not blind.
- Automatic scoring is not corrected. It disagreed with the review on about one judged line in five, from 14.08% to 30.16% depending on the model. No pure recognizer error rate was measured, and every automatic score in this article is the original measurement.
- Three runs show spread, not significance. The finalists were run up to three times per slide, and the repeats were scored automatically only. GPT Image 2 high was run once per slide.
- One slide template. All seven slides are synthetic horizontal timelines with a year at the top of each column, and the 3-block slide also has a much shorter brief than the 10-block slide. The results are about this template, not about infographics in general.
- Unequal frames and sizes. Returned frames ranged from 1024×576 to 2816×1584, 2.75 times in linear size. Small text suffers on a small canvas, so every line count is a count at a frame. The written brief asked for 1280×720 and the request asked for about 2560×1440. No generation came back at 1280×720, and the two instructions contradict each other, so a returned size that differs from the request cannot be read as disobedience.
- Not every model took every slide. 27 of 29 participants produced a measurable result. Two refused all seven slides because the brief exceeded their prompt-length limit, and seven more covered fewer than seven slides. A refusal does not say a model draws text worse; refused models were not re-run on a shortened brief.
- What the automatic scorer cannot see. It treats look-alike Latin and Cyrillic letters as the same, ignores letter case and drops the standalone dash between a year and an event. A model that writes a Latin "c" inside a Russian word scores the same as one that writes the Cyrillic "с".
The reassembly step our scoring depends on is published with its reliability indicator rather than asserted: 2.9% of ground-truth lines (47 of 1617) had their words scattered across unrelated reconstructed blocks, against a 10% threshold fixed before the recount. This indicator describes the reassembly step, not recognition accuracy.
The full limitations text is in methodology-notes.txt. The human review is in manual-calibration.txt and line-audit.csv, and the check of the measurer is in ocr-calibration.txt.
Test prompts, results and raw data
Everything behind the numbers above is published. Tables and text are released under CC BY 4.0; the images are for research and evaluation use only. The full terms are in the license file.
| File | What is inside | License |
|---|---|---|
| results.csv | One row per case, participant and run (294 rows: 250 with an image, 44 refusals or platform failures): model, tier, status, price, time, returned frame, both automatic text metrics, what the recognizer read, image file name | CC BY 4.0 |
| line-audit.csv | The human review: 304 expected lines with the person’s verdict, the automatic result, what the recognizer read and the image file | CC BY 4.0 |
| participants.csv | The 29 participants: model endpoint, request parameters, price per call, prompt-length limit | CC BY 4.0 |
| cases.csv | The 7 test slides: what each one varies, the exact prompt, the reference title and lines | CC BY 4.0 |
| ocr-detections.csv | Everything the recognizer detected on the 250 images, one row per piece of text, with its position and confidence. An image with no text found has one row with empty text | CC BY 4.0 |
| manual-calibration.txt | The human review: selection, results, disagreement with automatic scoring and its limits | CC BY 4.0 |
| methodology-notes.txt | The full limitations text: what was not measured and why | CC BY 4.0 |
| ocr-calibration.txt | What was checked about the measurer’s reassembly step | CC BY 4.0 |
| images.zip | The 7 input slides and the 250 generated slides (previews 1100 px wide), named by case, model and run | Research and evaluation only |
| report.html | All 250 generations on one page, next to their automatic scores and recognized text (20 MB) | Research and evaluation only |
| LICENSE.txt | License terms |
How to cite: Wonderslide (2026). Small-text infographic generation: 29 image models on 7 timeline slides. https://wonderslide.com/blog/infographic-small-text-image-models/
Columns in results.csv
- case: the test slide, D3 to I10 (see cases.csv).
- participant: the model and tier; participants.csv maps it to the endpoint and request parameters.
- endpoint, tier: the model called and the parameters sent with the request.
- repeat: 1 for round 1; 2 and 3 for the repeated runs of the finalists.
- seed: the seed sent with the request, where the model accepts one.
- status: completed, capability_refusal (the model declined, usually because the brief exceeded its prompt-length limit) or unavailable (the platform failed without an image).
- width, height, frame: the size of the image the model returned.
- seconds: generation time.
- price_usd: the list price of this attempt at the API intermediary. Only the final attempt for each cell is in the table, so the column does not add up to the total spend on retries.
- error: the platform’s message when a request failed.
- lines_exact: reference lines the automatic scoring counted as read back with no character difference. This is not a human judgment; compare line-audit.csv for the images a person reviewed.
- lines_total: reference lines on the slide.
- char_error_rate: the automatic average, over reference lines, of edit distance divided by line length, capped at 1; a line with no match counts as 1.
- blocks_found: reference lines where at least half of the words were found in the matched text.
- invented_words: words the recognizer read that are not in the reference text (any number, or a word of five letters or more that is not a near-typo of an expected word).
- title_preserved: 1 when the title is intact, lower as the title’s edit distance grows.
- reordered_line: true when some line’s words all sit in its own block but not as one in-order run.
- scattered_lines: reference lines whose words are all on the slide but never inside one reconstructed block.
- blocks_detected: text blocks reconstructed from the image.
- ocr_text, ocr_title_text: what the recognizer read in the body and in the title band.
- image_file: the image’s path inside images.zip.
Columns in line-audit.csv
- case, participant, repeat: the reviewed generation, the same keys as in results.csv. image_id joins them.
- sample: stratified (the 21 images of the three compared models) or flagged (the 9 diagnostic images).
- year: the year that identifies the reference line on the slide.
- image_sha256: the hash of the original image the person reviewed.
- expected: the reference line.
- human_verdict: exact (accepted), different (readable but not the same), unreadable or missing (absent).
- automatic_exact: whether automatic scoring counted the line as exact.
- comparison: true_positive, false_negative (a person accepted, automatic scoring did not), false_positive (automatic scoring accepted, a person did not), true_negative, true_negative (neither a person nor automatic scoring accepted the line), or excluded_unreadable.
- visible_text: what the person read, where recorded.
- automatic_candidate, ocr_blocks: the text block the scorer matched to the line, and the blocks it reconstructed.
- note: the reviewer’s note, where there is one.
- image_file: the image’s path inside images.zip (a preview; the hash refers to the original).
FAQ
Is GPT Image 2.5 low better for text than GPT Image 2 medium?
Not measurably. A person accepted all 71 lines from both in the first generation. Automatic scoring over three runs each cannot separate them either, nor GPT Image 2.5 medium: 56 to 62 exact lines out of 71. GPT Image 2.5 low costs a third as much.
GPT Image 2 low vs medium vs high: which quality setting should you use for text?
On automatic scoring, GPT Image 2 low is the one tier this study could tell apart from GPT Image 2 medium: over three runs it returned 52, 49 and 51 exact lines out of 71, against 56, 62 and 62. High bought nothing measurable over medium on one generation per case: 58 lines against 56, at 3.7 times the price.
How does GPT Image 2 compare with Nano Banana 2 on small text?
A person reviewed the first generation of both across the same seven slides. GPT Image 2 medium had 71 of 71 lines accepted and Nano Banana 2 Fast 43 of 71, at frames of 2048×1152 and 2741×1530. This covers these reviewed outputs only; it is not a ranking of the market or a guarantee for later generations.
Can AI image models write Cyrillic text?
For GPT Image 2.5 low and GPT Image 2 medium, yes: a person accepted all 10 Cyrillic lines in the first generation, where automatic scoring counted 7 and 9. Nano Banana 2 Fast was weaker: 2 of 10 Cyrillic lines accepted against 10 of 10 Latin. Cyrillic is harder for some models, not impossible.
How accurate is the automatic scoring of text in AI images?
We compared it with a person’s review of 30 original images. On 205 judgeable lines it disagreed on 44, or 21.46%, mostly lines it marked wrong that the person accepted. That measures the whole scoring pipeline, not the recognizer alone, and it differs by model, so it is not a correction factor for other scores.
Build infographic slides from your own data
The slides in this study were synthetic. Yours will not be. Wonderslide turns your document into a designed presentation, with timelines, charts and processes drawn from your data. Try it on your own deck. Upload a PDF, DOCX or PPTX and get a designed presentation in a few minutes. Free plan, no card required.
If you are comparing presentation tools rather than image models, see how much AI presentation makers cost and how to create visuals for your presentation’s key points.